Census 2023 – what different qualifications earn
18 March 2025 | news
By Chris Whelan
Late last year Statistics New Zealand started releasing data from Census 2023. That always provides a useful opportunity to see what is happening around earnings for people with and without post-school qualifications.
When the Census data is made available to researchers, we are able to link it with Inland Revenue data to see, at the time of the Census, actual average annual earnings by post-school qualification level and the subject studied.
As I’m sure everyone knows, Censuses take place roughly once every five years. Universities New Zealand did the same analysis around Census 2013 and Census 2018.
At the top level, income continues to show a relationship with the level and field of study that people do post-school. Table 1 show average annual gross income for everyone working full time at the time of the 2023 Census (1,730,400 people) aged 15 years or more.
The rows show broad fields of study as per NZSCED[1]. So, for example, Engineering includes Manufacturing, Process & Resource Engineering, Mechanical and Industrial Engineering, Geomatic Engineering, Civil Engineering, Electrical and Electronic Engineering, Maritime Engineering, Aerospace Engineering and Automotive Engineering. If you want to see more detailed information on narrow fields of study, you will find the information at this link here.
The columns show highest qualification gained in each field of study using the NZ Qualifications Framework. Cells are blank where there were less than 250 people with a particular combination of field of study and level of study.
Cells have a colour scale applied, so the biggest numbers are greenest and the smallest numbers are reddest.
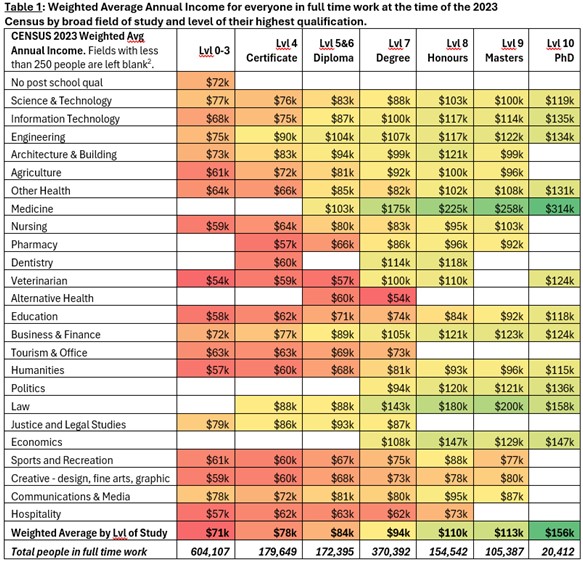
The fact that income increases with education and training is entirely consistent with the result of earlier Censuses.
There is a lot of additional information in the Census data – most of which will be covered in subsequent articles. This includes interesting observations such as 55% of people aged 30-39 at the time of the 2023 Census were in jobs that, based on the job title, appear to require at least 2-3 years of post-school education.
However, it is interesting to see how earnings have changed over the ten years between Census 2013 and Census 2023.
Table 2 below is the same as for Table 1 – but for Census 2013.

Comparing Table 1 (2023 Census) with Table 2 (2013 Census), it is clear that average income has increased over the ten year period. The Consumer Price Index (CPI) movement between Q2 2013 and Q2 2023 was 28.3%[3].
Table 3 shows the ‘real’ change in income between Census 2013 and Census 2023. ‘Real’ is defined as the value in Table 1 (Census 2023) minus the value in Table 2 (Census 2013) divided into the value in Table 2 (Census 2013) minus CPI of 28.3% - or Real=((2023-2013)/2013)-28.3%.
Again the table has a colour scale applied, so the biggest drops in ‘real’ earnings are redder and the largest increases are greener.
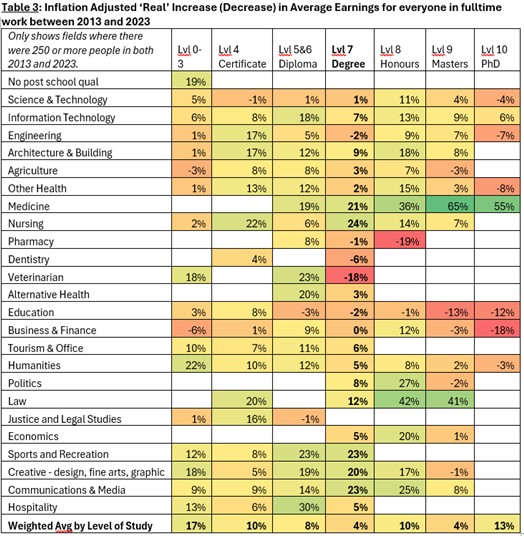
This paper cannot provide reasons for the increases and decreases. Presumably the main changes are related to supply and demand changes over the ten year period, but there may also be other factors within particular industries as regulatory and accreditation requirements have evolved. The structure of the economy has also evolved somewhat over the ten years and industry requirements have evolved in line with this.
On the face of it, however, health work has done well over the ten year period presumably (at least partly) as a consequence of widely publicised workforce shortages in key areas.
The sciences have remained relatively flat – although fields such as mathematics and physics have done notably better than fields such as biology and chemistry.
The humanities and social sciences have all done well. On the figures in Table 3, there does not appear to be any case for arguing oversupply or lack of demand for people across these fields, even though average income is lower than for the sciences. The income difference, however, is not that large.
Footnotes:
[1] NZSCED- New Zealand Standard Classification of Education, https://www.educationcounts.govt.nz/data-services/code-sets-and-classifi...
[2] 250 people has been chosen as a cut off as it removes fields where a small number of people skew averages upwards. This particularly affects professions where the requirements for registration has changed in the past 30 years – such as geomatic engineering (quantity surveying). Older practitioners are earning a lot without a diploma or degree, but newer practitioners all now have the required post-school education
[3] https://www.rbnz.govt.nz/monetary-policy/about-monetary-policy/inflation...